
Will you chip in to support our nonprofit newsroom with a donation today?
Yes, I want to support My MLTnews!
My Neighborhood News Group (MNNG) is publishing a series of stories on how local governments are funded and the financial challenges facing both elected officials and residents. You can read Part 1: Introduction here and Part 2: Where’s the money here.
“For people on fixed incomes, the cumulative effect of State Tax Increases, Snohomish County increases in Property Valuations… the total increase in tax is a tough one to swallow. When are we going to reach “enough already”? Sept. 8, 2025 My Edmonds News comment section
In 2000, the State Supreme Court threw out the second part of Tim Eyman’s I-695 initiative. The second part required the state Legislature to get voter approval prior to any tax increase.
Eyman complied and, in 2001, submitted his next anti-tax initiative, I-747. The initiative set an annual limit to property tax increases. The annual increase would be no more than 1% annually or the rate of inflation, whichever is less. This “whichever is less” is important because it has a lasting impact.
In its analysis, the state Office of Financial Management (OFM) spelled out the impacts at the time.
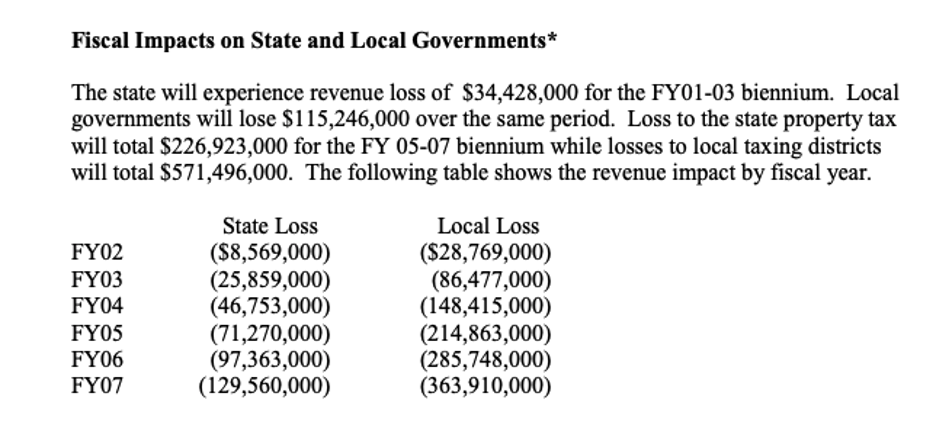
*Note: Estimates of property tax losses from the initiative were provided by the State Department of Revenue. All estimates are provisional and based on assumptions that are subject to change. These figures provide a sound estimate of the magnitude of the revenue losses in the aggregate.
Note this statement from 2001: “The owner of a $150,000 home would realize a property tax reduction… of $23 in 2002. That property tax savings would grow to $127 in calendar year 2007.”
The impact for both property owners and taxing districts grew exponentially wider and wider.
“The local losses in property tax revenue reflect the impact on local regular property tax districts,” OFM said. “These districts include, among others, counties, cities, counties, fire districts, library districts, hospital districts, cemetery districts and emergency medical service districts. State property tax revenues are dedicated to funding basic education.”
That 2001 statement came directly from the OFM. The office is required by law to attach a fiscal note that explains the financial impacts of legislation.
The I-747 push was not a new effort. Referendum 47 in 1997 and I-722 in 2000 whittled down the property tax cap from 6% to 2%. Then, in 2001, the Legislature approved the lower rate — 1%.
Even if the Consumer Price Index (what we pay for things) goes up 2 or 3%, property taxes only go up 1%. Property taxes lose purchasing power — it is built in.
I-747 was eventually overturned by the State Supreme Court in 2007. But it was too late. The Legislature in 2001 heard from voters loud and clear and agreed to limit property tax increases to 1% annually starting in 2002.
The financial impact hit. Every year the Consumer Price Index has gone up more than 1%, except the 2008-2009 recession years. As a result, the property tax generates less money than it costs to fund the things it is intended to pay for.
The city only gets a 1% increase in what the city currently gets — it does not get a 1% increase on your total tax bill or the assessed value of the property.
The Snohomish County Assessor’s Office has a three-minute video that explains property taxes – what they fund and how they are assessed.
In a Nov. 30, 2025 article published by My Neighborhood News Group, County Councilmember Nate Nehring explained how property taxes are calculated and distributed. It is complicated and worth reading if residents want a better understanding of a very complicated process.
In hard numbers, what does the 1% increase in property taxes look like for a city?
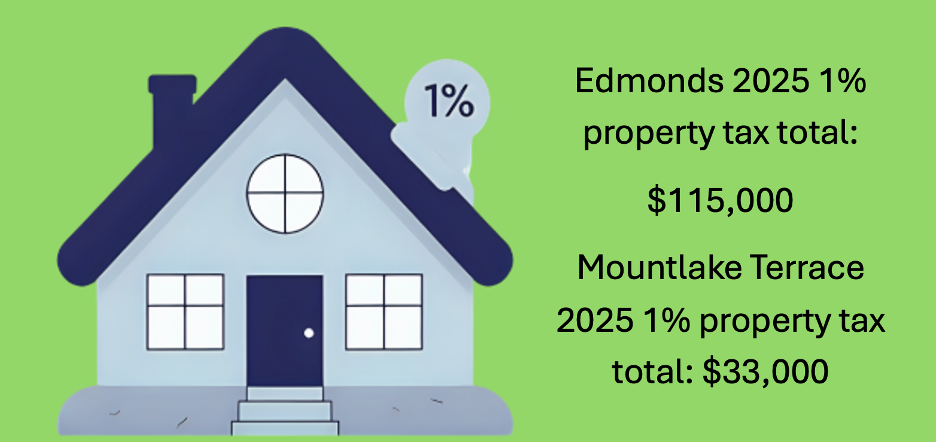
Here’s what happened in Mountlake Terrace on Nov. 20, 2025 when the City Council agreed to approve the City’s portion of the 1% increase in Snohomish County property taxes. The City’s revenue increase was just $33,000.
That $33,000 split among all property owners amounts to $2.84 increase per household for the year. Or as City Councilmember Rick Ryan said, “You can’t even buy a cup of coffee with that.”
You can’t buy a lightbulb to replace a stop light either.
The graph below indicates what the smaller piece of the pie looks like in Mountlake Terrace. Each year, the proportion of purchasing power decreases.
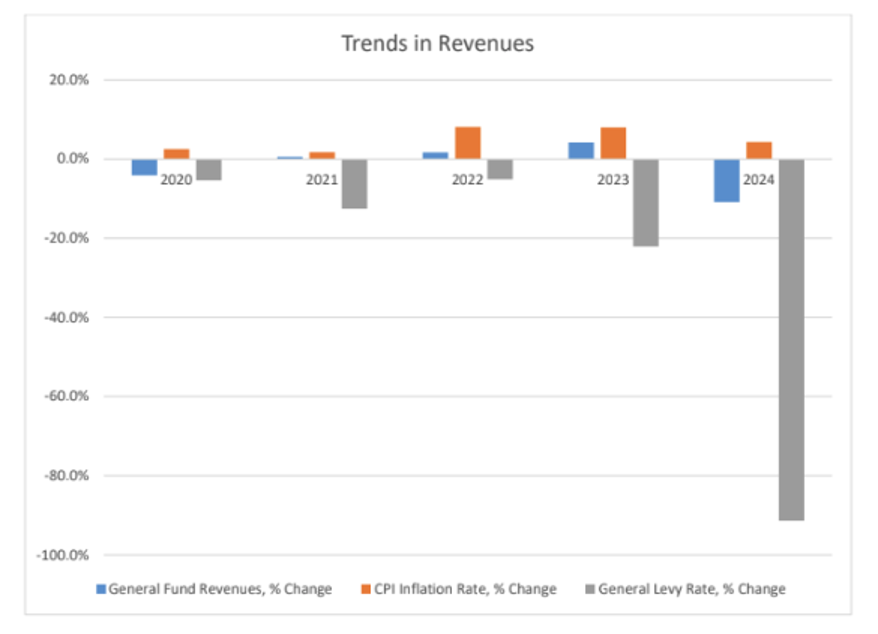
Like the car tabs in 2000, the financial impact of the 1% property tax limit hit hard at the time and the impact was lasting.
This didn’t affect just some Washington cities. It hit all Washington cities. When asked about the economic number that paints their economic picture, the Association of Washington Cities said the number 1.
“The statewide restriction of property tax revenue collections being capped at 1% means that cities cannot keep up with the rising cost of providing local services,” a spokesperson said.
This 1% is lower than inflation, which has averaged 3% per year during the last decade. It is also lower than the population, which grew 1.5% per year.
Cities and counties have less money to spend on more people.
“Local revenue sources such as property taxes have not kept pace with the rising costs of supplies, staff and services, nor the rising demand for county services as the population grows,” said Kari Bray of Snohomish County.
Of the four pillars of local government funding – property tax, consumption tax, fees and grants – property tax is one of the largest pieces of the economic pie.
But our property values go up every year. Doesn’t that mean the government gets more property tax? Yes. Dollar for dollar, that is true. But when compared to the cost of local government services (inflation, commodities and other structural imbalances) it never keeps up.
In other words, if you get a 50-cent-per-hour raise for a total of $20 more each week, but your grocery bill is $30 more each week, that raise functions like a $10 loss.
Going back to our personal economy analogy. You save $1,000 each month expecting to buy that new $60,000 car in five years. Five years later, that car is no longer $60,000. It’s $80,000 and your $1,000 per month has actually lost value. It’s now about $900 a month. Do that math. You get more behind every year, and you’ll never get that new car.
That is exactly where local governments are right now.
Next: All the fees and taxes work, until something changes. Spoiler alert: Something always changes.

Real first and last names — as well as city of residence — are required for all commenters.
This is so we can verify your identity before approving your comment.
By commenting here you agree to abide by our Code of Conduct. Please read our code at the bottom of this page before commenting.